Dow Falls Below 50-Day Moving Average, Signaling Risk Ahead
The Dow Jones Industrial Average has breached a closely watched technical level, raising concerns among chart-focused investors about further declines.
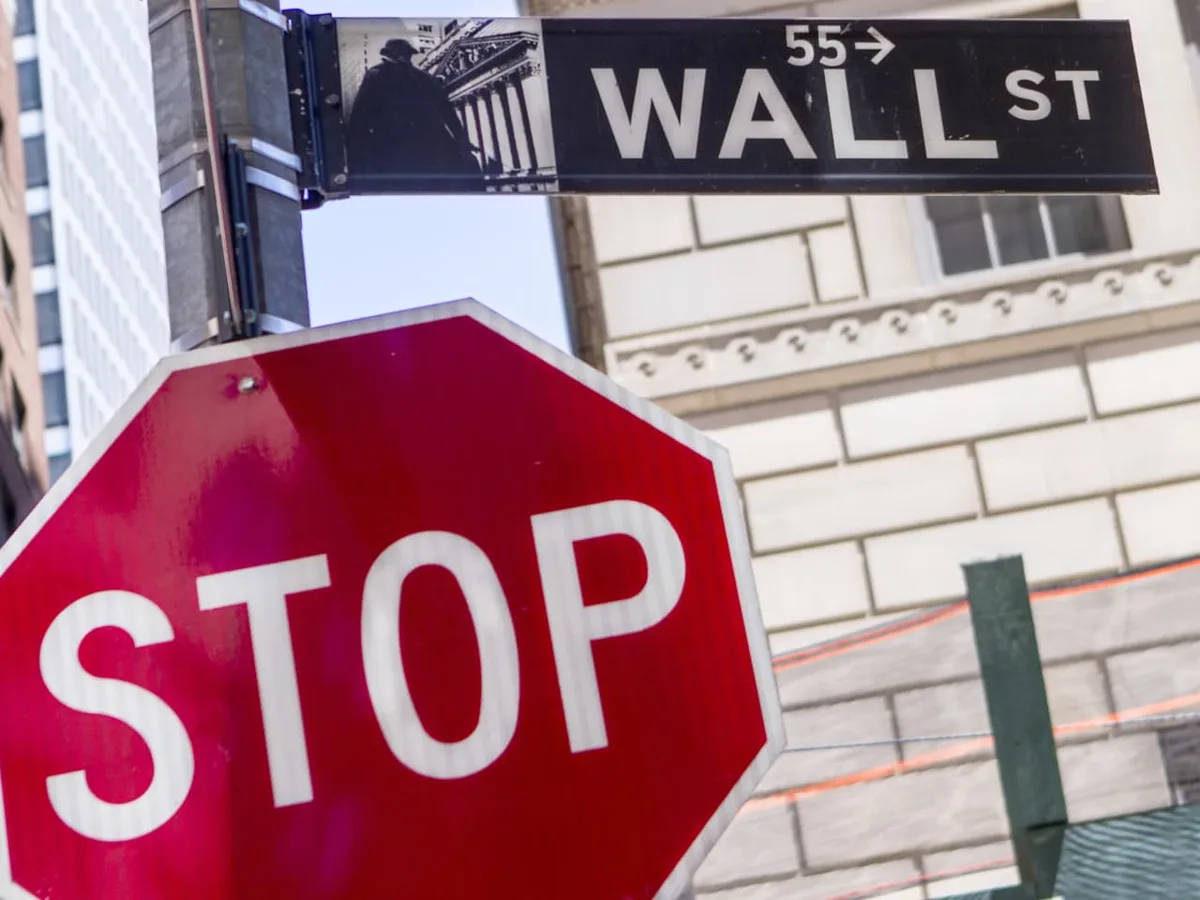
The Dow Jones Industrial Average slipped beneath its 50-day moving average, a technical threshold that market analysts treat as a reliable barometer of short-term momentum. When a major index breaks below this level, it often signals that the prevailing trend is weakening — and that sellers may be gaining the upper hand over buyers who had previously supported the rally.
The significance of this particular breach is amplified by historical context. The last time the Dow closed below its 50-day moving average was April 10, a date that marked the tail end of a painful correction phase. That downturn, at its most severe, dragged the index down by roughly 5,000 points — a decline steep enough to rattle both retail and institutional investors before a recovery eventually took hold.
Read more Kalshi Bans George Santos for Life Over Insider Betting Violations →
Technical levels like the 50-day moving average matter not because they possess any intrinsic economic meaning, but because enough market participants watch and act on them to make them self-fulfilling. A confirmed close below such a level can trigger stop-loss orders and prompt momentum-driven traders to reduce exposure, potentially accelerating the very selloff the signal warns about.
What this moment demands from investors is measured perspective. A single close below a moving average does not guarantee a sustained decline — markets frequently test these levels before rebounding. But given that the prior breach coincided with a multi-thousand-point correction, traders and long-term investors alike have reasonable grounds to monitor price action closely in the sessions ahead.
Continue reading at MarketWatch.com